HOG is a visual descriptor i.e., it describes the content of an image in a single feature vector. The idea behind HOG is that local object appearance and shape within an image can be described by the distribution of intensity gradients or edge directions.
HOG descriptor
As shown in the figure, we first compute the gradient map. HOG descriptor is calculated for a window size of 64x128, by dividing it into 8x16 cells and in each cell we calculate the orientation of all pixels and form a magnitude weighted 9-bin histogram of gradients. These gradients are normalized by overlapping block size of 2x2 cells. Finally we concatenate all the orientations into a single vector of length 3780. For more deeper understanding of HOG, please refer to this nice tutorial
NOTE: Here numerical values are taken to explain the mathematics of HOG calculation. These values can be varied while computation
I trained soft margin linear SVM model on the dataset with 4419 positive samples and 5380 negative samples. I did two iterations of hard negative mining to improve the results and also performed non-maximum suppression to filter out multiple overlapping detection windows.
Pedestrian Detection
Out of curiosity and understanding the HOG feature space, I projected 3780 dimensional HOG features of all the images onto 2-dimensional subspace using a dimensionality reduction technique called t-SNE and generated t-SNE visualization using the code provided by Dr. Andrej Karpathy. Click here for bigger image. Observe how images are clustered.

t-SNE Visualization
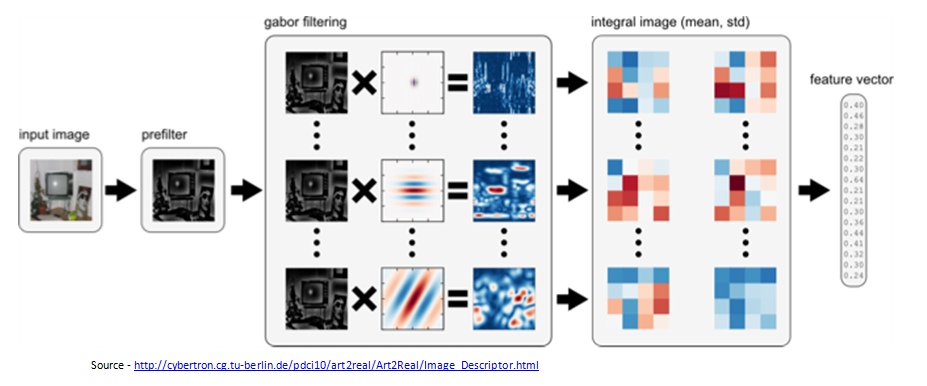
GIST is the low dimensional representation of an Image. It encodes the structural information of the image by dividing the image into blocks, thus providing a rough description of the image. The block diagram of how GIST is computed is shown below. For more theory, refer to this paper.

GIST block diagram
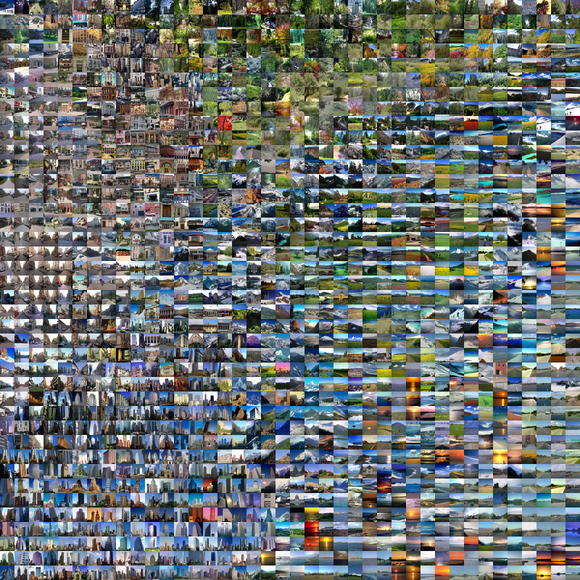
In order to visualize how GIST feature could encode the information of an image, I projected the 512-dimensional GIST feature vector to a 2-dimensional space using t-SNE and generated t-SNE visualization using the code provided by Andrej Karpathy.

t-SNE visualization
Please download and zoom into different parts of the image and see how similar images are clustered together. Using GIST features of images, we can retrieve the nearest image using KNN or train K-means to generate clusters for similar images. One of the application could be to find duplicate images in the Gallery.
This is the implementation of the algorithm in this paper. It is a new system to produce pencil drawings from natural images. This method mimicks the human style of Pencil Drawing by combining tonal and sketch structure.
Note: Software does not include color pencil sketch for now!
This is a GUI application developed using OpenCV and Qt. This application can be used to experiment the following functionalities.
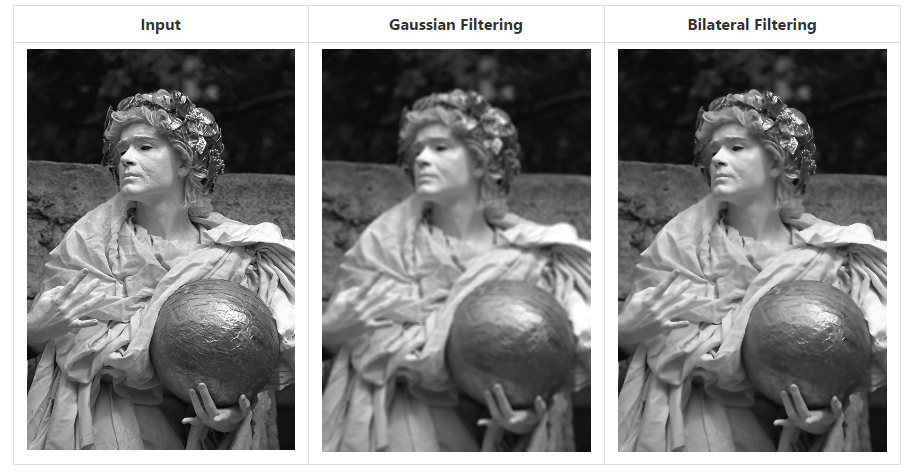
A bilateral filter is a non-linear, edge-preserving and noise-reducing smoothing filter for images.

The Canny edge detector is an edge detection operator that uses a multi-stage algorithm to detect a wide range of edges in images
I have been coding in Python for a while. You can find a very good introductory book on Python by Swaroop which introduces different concepts of Python language very well.
I have made a IPython notebook while practising the code given in this book. You can check it out in the below github link. I constantly refer to this when I am coding.